Throughput is not progress
An author-run study of 1,979 commits linked to pull requests in one repository, examining changed files, recorded author identities and review records.
- Kind
- Result, measured by the author
- Published
- Revised
- History
- 2 revision notes (September 12, 2026; September 23, 2026), kept in the text
- Filed under
- Agent security
Question
Between July and August 2026, I directed AI coding agents working in a private GitHub repository. Over six weeks, they used roughly a hundred Git identities, taking on tasks through branches and submitting pull requests (PRs). Around 2,300 merged PRs, roughly 50 a day, suggested substantial activity. I wanted to understand what those changes contained.
The question is not whether agent PRs get merged. Existing work already measures acceptance across many projects. My question is narrower: in one repository at a fixed version, what was the composition of the PR stream, whose identity survived the merge, and who reviewed it? This study measures changed files and recorded identities, not merge rate. It does not establish what caused the observed patterns.
This census is the measurement half of the agent security research on this site. The control half is an approval gate that decides what an agent is allowed to do in the first place.
Object and method
I studied the private repository thisisntjon/poketcg at commit 9522a8a37078d00f46b99a586b825b789b01387d. I took the first-parent history at that pin and called a commit PR-linked if its subject carried a PR number in the squash or merge form. Files and churn come from git log --numstat. Each PR-linked commit gets one file-shape label from the codebook: docs_only if every changed path is .md or .txt, has_code if at least one path is a source-code suffix, other if neither, and small if additions plus deletions are under 100. These labels describe the files changed, not the value of the work.
A stratified sample of 80 PRs was then inspected by one person for intent, and a seeded sample of 40 PRs had its GitHub reviews pulled through the API.
The minimum coverage threshold was set before the study: if the file list covered less than 80% of GitHub-merged PRs, the measurement method would be considered invalid. Observed coverage was 1,979 / 2,338 = 84.6%, meeting that threshold. The 15.4% gap is not imputed. The instrument, the pre-registration, and the full dataset are public in the seed-protocol repository under workflow/research/2026-08-24-pr-case-study/.
Findings
| Measure | Value | Qualifier |
|---|---|---|
| PR-linked first-parent commits | N = 1,979 | 84.6% of 2,338 GitHub-merged PRs |
docs_only |
855, 43.2% | earlier estimate ~2026-08-16: 44.7% |
has_code |
761, 38.5% | |
other |
362, 18.3% | |
| churn < 100 | 786, 39.7% | earlier estimate: 39.6% |
Bound if every missing PR were has_code |
855/2,338 = 36.6% docs-only | adversarial fill |
| Peak week, 2026-07-08 | 652 landings, 58.4% docs-only, 29.8% has_code | |
| Week of 2026-08-12 | 79 landings, 6.3% docs-only, 77.2% has_code | |
Unique names, git shortlog -sn --all |
103 | agent identities appear only on branches outside main |
| Unique names on PR-linked squash commits | 2 | |
| Independent human GitHub review, not author | 0/40 | Clopper-Pearson 95% interval 0 to 8.8% |
| PRODUCT in the 80-PR intent sample | 2, 2.5% | stratified sample; not a population estimate |
On this pin, 43.2% of PR-linked commits changed only Markdown or text files, and 39.7% had churn under 100 lines. These update the earlier estimates of 44.7% and 39.6%; they are nearby values, not identical results. Churn is heavy-tailed: p50 = 146, p90 = 1,349, p99 = 8,879, max = 135,280. This study reports the distribution rather than using a mean as a measure of progress.
The time series is the part I find most useful. The figure below shows the weekly file-shape mix.
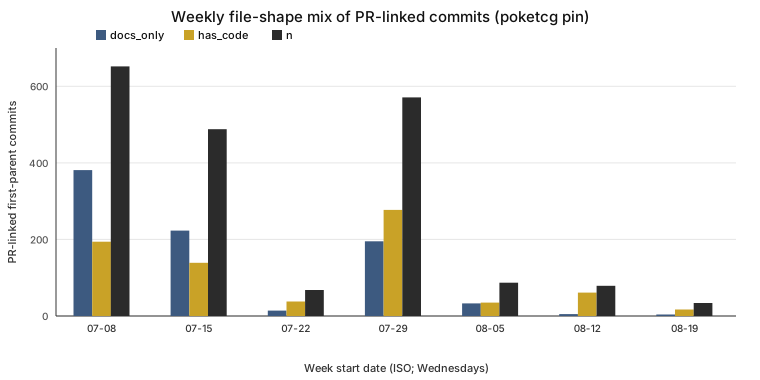
Source: artifacts/summary.json field weekly. Object: poketcg (private repository) at pin 9522a8a37078d00f46b99a586b825b789b01387d. Labels: docs_only = every changed path is .md/.txt; has_code = at least one .py/.go/.js/.ts/.rs/.java/.c/.cpp/.h; n = PR-linked first-parent commits that week (CODEBOOK.md). Author-run, not independently reproduced.
The highest-volume week, July 8, had 652 landings and a 29.75% code share; July 15 was lower at 28.48%. By August 12, code share was 77.2% of 79 landings, although the number of code-containing commits had fallen from 194 to 61. These figures describe the changing composition of work. They do not measure whether the player improved.
Identity collapses at the merge. Across all refs, git shortlog -sn --all shows 103 names. On the PR-linked squash commits that make up main, there are 2. The agents worked under those Git identities on branches, but squash merges replaced them with the shared commit identity. The individual agent identities also do not appear in the pull requests’ GitHub user field. An analysis based only on those GitHub identities would see a solo developer.
In the seeded sample of 40 merged PRs, 17 had reviews from the bot connector. One of those also had a review from the PR author’s human login. Independent human review on GitHub was 0/40, with a Clopper-Pearson 95% interval of 0 to 8.8%. My workflow called for authorship and verification to be assigned to different agents. The GitHub review graph alone cannot establish whether that separation occurred in the surrounding research workflow.
Finally, the intent sample. Of 80 inspected PRs, 2 were classified as playing-agent changes. Saved evidence records accounted for 29/80. The categories labeled governance and ceremony in the codebook together accounted for 30/80. The 2.5% PRODUCT share describes this stratified sample; it is not an unweighted population estimate or a statistical upper bound. Harness and evaluation work may support the player without editing its policy directly. These labels do not measure the value of that work.
Reading the numbers
This case shows why merge volume is insufficient evidence of product progress. Docs-only changes were the largest file-shape category at 43.2%, and shared squash-merge identities limited what main could reveal about individual branch contributions (103 Git names across all refs versus 2 on main, which are artifacts of where you look rather than a count of independent agents). That does not mean documentation is waste: the project produced a written playbook, and the finding concerns using output volume as a proxy for improvement rather than the value of writing things down.
The census also measures commit composition rather than comparative merge rates or off-GitHub verification. While the 40-PR sample recorded no independent human GitHub review, the GitHub review graph alone does not show whether separate checks occurred in branch verification records, and judging whether the player improved requires separate game-outcome evidence.
Limitations
This is a descriptive case study of one repository directed by one person. It does not estimate a treatment effect or establish generality beyond this setting.
The instrument is public: measure_pr_census.py.
The intent labels come from one inspector on n = 80. Exact agreement between the automatic pass and the human pass was 50/80 = 62.5%. Another inspector could classify some records differently. The file-shape census does not resolve those intent judgments or establish a bound on useful project output.
Coverage is 84.6%, and the missing 15.4% of GitHub-merged PRs is not imputed. Under the adversarial assumption that every missing PR had code, docs-only would still be 855/2,338 = 36.6%.
The source repository, thisisntjon/poketcg, is a private repository and will stay that way. The public dataset is the artifacts/ folder in seed-protocol, pinned to 9522a8a37078d00f46b99a586b825b789b01387d. New merges on the source will move the rates. Cite the recorded commit so the reported values remain traceable.
Data
Updated September 12, 2026: corrected the weekly ranking and bot-review count, distinguished earlier estimates from current results, and narrowed the interpretation of composition and sampling. The dataset and research question are unchanged.
All files are in the public seed-protocol repository under workflow/research/2026-08-24-pr-case-study/.
- PAPER.md, the full case study with methods, tables, and threats to validity
- CODEBOOK.md, the label rules
- artifacts/summary.json, machine-readable results including the weekly series
- artifacts/pr_index.jsonl, one row per PR-linked commit
Editorial update, September 23, 2026: clarified the summary and terminology. The methods, data, results and earlier correction record are unchanged.